Scanning electron microscopy
The method that produces a picture rather than a number — and the one whose result depends most on how the sample was chosen.
- Cited on certificates as
- SEM
- Standard
- —
- Reports
- Appearance and particle morphology · Coating and film integrity · Foreign particle characterisation
What SEM is
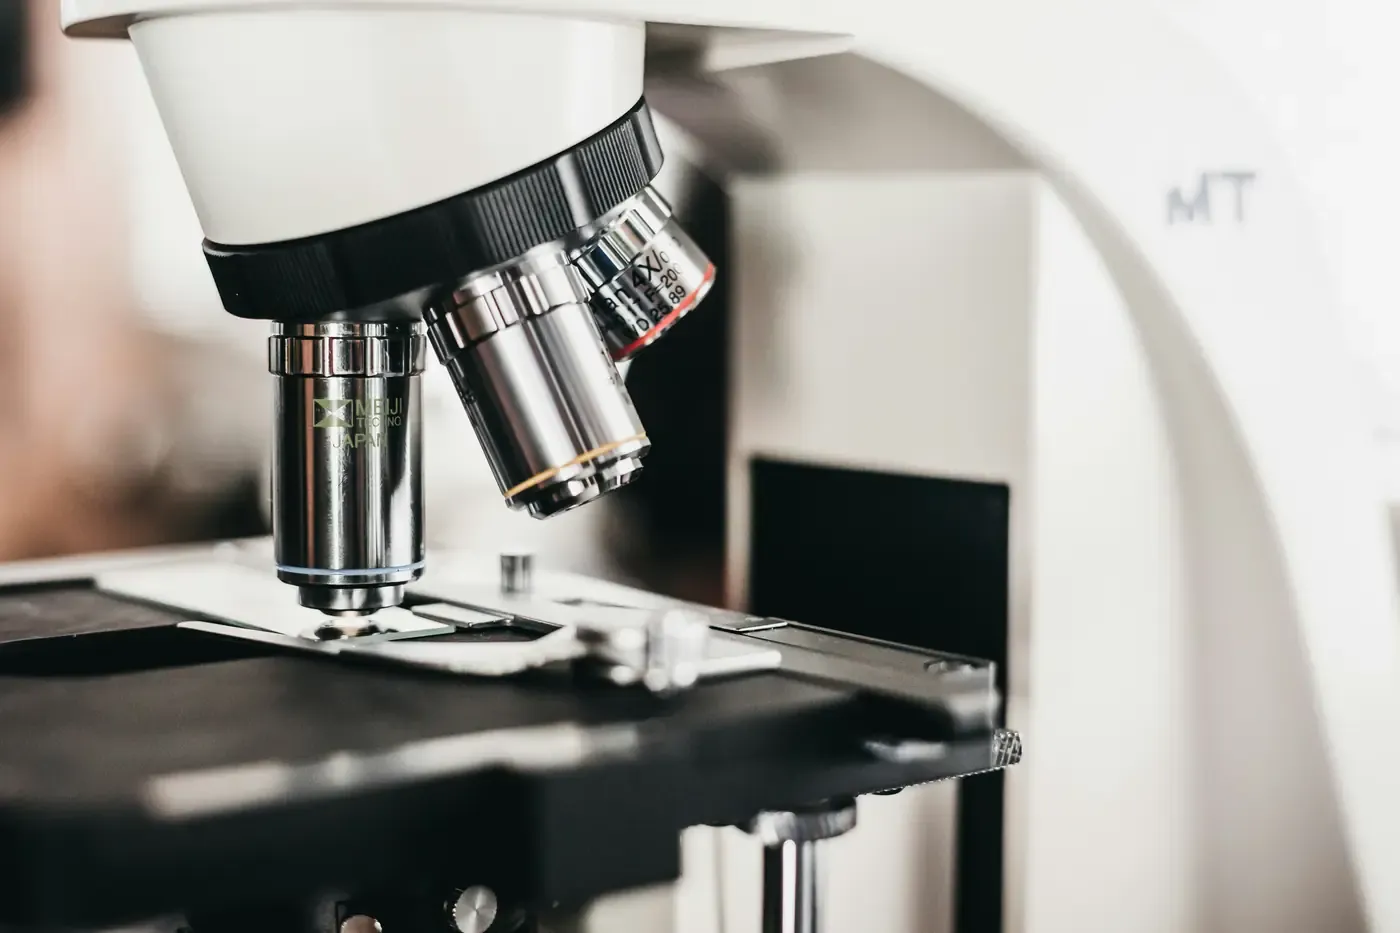
Scanning electron microscopy builds an image with electrons instead of light. A focused beam is swept across the specimen point by point, and at each point the electrons knocked loose from the surface are counted. Brightness at a pixel is that count, so the picture is assembled one measurement at a time rather than projected all at once.
What this buys over an optical microscope is resolution and depth. Electrons have a far shorter wavelength than visible light, so features a few nanometres across can be resolved where an optical instrument stops around 200 nm. Depth of field is the less celebrated advantage and often the more useful one: a rough powder can be in focus from the top of a crystal to the stub beneath it, which no optical image of the same field would be.
The specimen sits in vacuum and is usually coated with a few nanometres of gold or carbon so that charge can drain away. Both of those are impositions on the sample, and both can change what is being looked at, which is why the preparation is part of the result rather than a step before it.
As stated on a certificateA focused electron beam is scanned across the specimen and the secondary and backscattered electrons it releases are collected point by point, building an image of surface topography and compositional contrast at magnifications an optical microscope cannot reach.
How it works
Mounting
The sample is fixed to a stub, generally on conductive tape or with a carbon paint. How a powder is dispersed at this stage decides whether the agglomerates in the image came from the material or from the mounting, and that ambiguity cannot be resolved later from the picture.
Coating
A non-conductive sample is sputtered with a few nanometres of gold, platinum or carbon so that the beam current has somewhere to go. Without it charge builds on the surface and the image drifts, streaks or goes white. The coating also covers the finest surface detail, which is the trade being made.
Scanning
The beam is rastered across a chosen field under vacuum. Accelerating voltage sets how deep it penetrates: low voltage stays near the surface and shows texture, high voltage goes deeper and shows what is under it, and the two produce visibly different pictures of the same spot.
Collection
Secondary electrons, released from the top few nanometres, carry topography. Backscattered electrons, reflected from deeper, carry atomic number — heavier elements come back brighter. The detector chosen is therefore a choice about what the image is of.
Elemental analysis, when asked for
The beam also knocks out inner-shell electrons, and the X-rays emitted as the atoms relax have energies characteristic of the element. Collecting those is energy-dispersive X-ray spectroscopy, which turns a bright speck in an image into a list of the elements in it.
Reading what it produces
- Every image carries its own conditions, and they are not decoration. Magnification, accelerating voltage, detector mode and working distance change what a surface looks like, so two micrographs compared without them are not comparable. A certificate quoting an image should quote the bar and the conditions with it.
- The scale bar is the only thing that fixes size. Magnification figures refer to the original capture and stop being true the moment an image is cropped or reprinted at another size; the bar is drawn in the image and survives both.
- Brightness in a backscattered image means atomic number, not height. A bright inclusion is heavier, not raised, and reading the two modes as though they showed the same thing is the commonest mistake made with these pictures.
What we report from it
Every one of these is a measurement made in this laboratory on the sample as received. The certificate names the method behind each figure, because the method is most of what the figure is worth.
- Appearance and particle morphology
- A described observation: crystal habit, whether particles are needles, plates or equant, the state of agglomeration, and surface texture. It refines the appearance line a certificate already carries rather than replacing it.
- Coating and film integrity
- Whether a coating is continuous or shows cracks, pinholes or incomplete coverage, and in cross-section how thick it is and how well it adheres.
- Foreign particle characterisation
- The shape of an unexpected particle and, with EDS, the elements in it — which is what allows it to be compared against a suspected source rather than merely noted.
The instrument
What a laboratory running this method has on the bench, and what each part decides about the result.
- Electron gun
- Produces the beam, from a heated filament or a field-emission tip. The source sets the smallest spot achievable and so the finest detail resolvable.
- Electromagnetic lenses
- Focus and demagnify the beam to a spot a few nanometres across. They steer electrons with fields rather than bending light with glass.
- Scan coils
- Sweep the spot across the field in a raster. Magnification is simply how small an area that raster covers.
- Vacuum system
- Electrons travel no useful distance in air. The column is evacuated, which is also what a hydrated or volatile sample has to survive.
- Secondary and backscattered detectors
- Collect the two electron populations that carry topography and composition respectively.
- EDS spectrometer
- Where fitted, records the characteristic X-rays and reports which elements produced them.
The detector decides what is visible
The column separates; the detector is what turns that separation into a number. It is also the half a method name mentions only in passing — the -UV in RP-HPLC-UV is not a suffix, it is the reason the purity figure is an area percentage at one wavelength. Every detector is blind to something, and what it cannot see does not appear on the chromatogram however much of it is there.
Secondary electron
- Sees
- Topography, in the most intuitive way: electrons escaping the top few nanometres, so edges glow and the picture reads like a lit landscape. This is the standard morphology image.
- Blind to
- Composition. Two materials of very different elements can look identical, so an SE image alone cannot say whether a particle belongs to the sample or arrived from somewhere else.
Backscattered electron
- Sees
- Atomic number contrast. Heavier elements scatter more electrons back, so a picture in shades of grey sorted by mass — which finds an inorganic inclusion in an organic matrix immediately.
- Blind to
- Fine topography, which it flattens. It also cannot distinguish two elements of similar atomic number, and it says which is heavier, never which element it is.
Energy-dispersive X-ray spectroscopy
- Sees
- Which elements are present in the volume the beam excites, and roughly in what proportion. It is what turns "there is a bright speck" into "the speck contains iron and chromium".
- Blind to
- Hydrogen, helium and lithium, which emit no usable characteristic X-rays — so it is blind to a great deal of organic chemistry. It also samples a volume around a micron across, so a thin surface film reports mixed with whatever is beneath it, and its quantitation is approximate without standards.
What it cannot establish
This list is the reason the rest of the page is worth reading. A figure, or an observation, means what its method can support and nothing past it.
- 01An image is evidence about the fields imaged and about nothing else. An instrument that looks at a few square microns at a time can be pointed at the most convincing part of the stub, and the resulting micrograph will be entirely true and completely unrepresentative. A morphology statement is worth what its sampling is worth, so a certificate citing one should say how many fields were examined and how they were chosen.
- 02It measures no amount. SEM reports no purity, no assay, no content, no potency and no identity of a bulk material. A picture of well-formed crystals is not evidence that the compound is the declared one, and it is not evidence of anything about the ninety-nine per cent of the batch that was not on the stub.
- 03Preparation makes features that were not there. Vacuum shrinks and collapses hydrated material, drying cracks films, sputter coating hides the finest texture, and grinding or fracturing to expose a cross-section creates edges that look like damage. Distinguishing a real defect from an artefact needs controls and repeated fields, not a better photograph.
- 04EDS is elemental, not molecular. It reports which elements the beam excited, which means it cannot tell a sulfate from a sulfonate, or one organic compound from another with the same elements. It is also blind to the lightest elements entirely.
- 05It says nothing about water content, counter-ion identity, endotoxin or biological activity, exactly as the other methods here do not.
Where it is used
- Crystal habit and particle shape, compared between batches or process conditions
- Agglomeration and fines after milling or micronisation
- Coating continuity, thickness and adhesion, in plan view and in cross-section
- Pore structure in lyophilised cakes, membranes and scaffolds
- Foreign particle investigation, with EDS to compare against a suspected source
Questions people arrive with
Asked about SEM often enough to be worth answering here rather than by return of email.
Anything else, and the answer comes from a person rather than a page. Write to the laboratory.
What is scanning electron microscopy?
An imaging technique that builds a picture with electrons rather than light. A focused beam is swept across the surface point by point and the electrons it knocks loose are counted at each point, which gives far finer resolution than an optical microscope and a much greater depth of field. It shows surface shape and texture; it does not weigh, assay or identify a bulk material.
What questions does it actually answer?
Shape and surface questions. What do the particles look like, are they needles or plates, are they stuck together, is this coating continuous or cracked, how thick is that layer in cross-section, what does this unexpected speck look like. With energy-dispersive X-ray spectroscopy it also answers which elements are in a particular spot, which is what lets a foreign particle be compared against a suspected source.
How is it used in formulation work?
Mostly for comparison. Two batches of the same material, or the same material before and after milling, spray drying or a change of crystallisation conditions, imaged under identical settings. The value is in the difference between the pictures rather than in any single picture, because particle shape and agglomeration affect flow, blending, compaction and dissolution in ways a specification often does not capture.
What is the difference between SEM and TEM?
Where the electrons go. SEM scans a beam across a surface and collects what comes back, so it images the outside of a specimen that needs no special thinness and can be a powder, a film or a fracture face. TEM passes electrons through a section thin enough to be transparent to them and images what is inside: lattices, internal interfaces, the structure of a nanoparticle. Surface and outside for one, interior and ultrastructure for the other.
Why is sample preparation treated as part of the result?
Because it creates findings. Vacuum collapses hydrated material, drying cracks films, poor dispersion turns loose powder into apparent agglomerates, sputter coating buries the finest texture, and cutting a cross-section leaves edges that look like damage. Every one of those appears in the image as though it were a property of the sample. Telling an artefact from a real feature needs controls and repeated fields; it cannot be done by looking harder at one micrograph.
Does an SEM image prove anything about the batch?
About the fields imaged, yes. About the batch, only to the extent that those fields were chosen to be representative, and that is a statement about sampling rather than about microscopy. A micrograph of the best-looking corner of the stub is a true photograph of an unrepresentative place. This is the question to ask of any morphology claim, including ours.
Is this method run at ZEIKKA?
Yes, where morphology is the question. A certificate carrying an SEM observation states the imaging conditions and how many fields were examined, because without those an image says less than it appears to: it is evidence about the fields imaged and about nothing else.
Also cited on certificates
HPLC
The separation most purity figures begin as: a mixture pushed through a column, and a detector recording what comes off and when.
LC-MS/MS
A chromatographic separation feeding a mass spectrometer, so a component can be weighed rather than only timed.
GC
The separation for things that will travel as a vapour — residual solvents above all, which is the line a purity figure by HPLC cannot fill in.
SFC
The separation that can tell two mirror images apart — and the only one here that can, because on every other column they are the same compound.
Holding a certificate that cites SEM?
Check its number against our record. No account, and the same check is open to anyone holding the document.