Reversed-phase HPLC with UV detection
The separation most purity figures begin as: a mixture pushed through a column, and a detector recording what comes off and when.
- Cited on certificates as
- RP-HPLC-UV
- Standard
- USP <621> Chromatography
- Reports
- Purity · Identity · Net quantity
What HPLC is
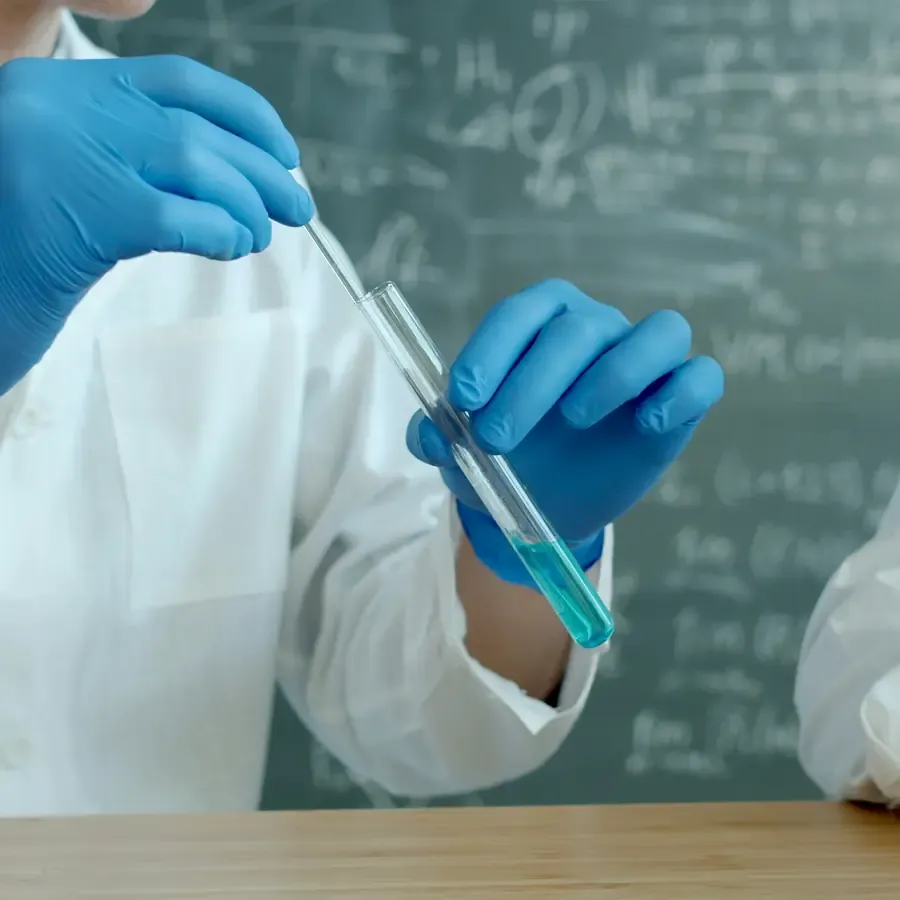
High-performance liquid chromatography separates a mixture by pushing it, dissolved, through a column packed with a stationary phase. Each component is held back by that phase to a different degree, so they leave the column at different times. A detector at the outlet records what passes, and the record it draws — absorbance against time — is the chromatogram.
“Reversed-phase” names which way round the two phases are. In the classical arrangement the stationary phase is polar and the mobile phase is not; here it is reversed, and the column is packed with a non-polar phase — usually silica with C18 chains bonded to it — while the mobile phase is water mixed with an organic solvent. Non-polar compounds linger on the column and polar ones pass quickly, which is the order a chromatogram reads in.
The “UV” is the detector. It measures how much ultraviolet light the eluent absorbs at a chosen wavelength, and the area under a peak is proportional to how much of that component passed through it.
As stated on a certificateSeparation on a C18 stationary phase with gradient elution, quantified by UV absorbance against a certified reference standard.
How it works
Injection
A few microlitres of the dissolved sample are placed at the head of the column by an autosampler. The volume is small and fixed, because the quantity injected is one of the things a quantitative result depends on.
Gradient elution
The mobile phase starts mostly aqueous and grows richer in organic solvent over the run. Compounds come off in order of how strongly they hold to the stationary phase, and the gradient is what brings the strongly held ones off in a reasonable time and as a sharp peak rather than a long smear.
Separation on C18
The stationary phase is octadecylsilane bonded to porous silica, typically 3–5 µm particles in a 4.6 × 150 mm column. Small particles and an even packing are what separate two compounds that leave the column seconds apart.
Detection
The eluent passes a flow cell and the detector records absorbance. Peptides are commonly read near 214 nm, where the amide bond of the backbone absorbs, or near 280 nm where aromatic residues do. The choice of wavelength changes which components are visible and by how much.
Integration
Boundaries are placed around each peak and the area within them is computed. Purity is reported as the main peak’s area as a percentage of the total integrated area. Where those boundaries sit changes the number, which is why a method specifies them rather than leaving them to judgement.
Reading what it produces
- The horizontal axis is retention time and the vertical is absorbance. A component that holds strongly to the column appears further right.
- The large peak is the main component. Its area relative to everything else is the purity figure.
- The small peaks are related substances — impurities from synthesis, degradation products, residual reagents. Each is integrated and reported rather than dismissed as noise.
- The dashed window a chromatogram is usually printed with marks the integration boundaries. Where they are placed changes the number, so a method that does not specify them has not specified the result.
What we report from it
Every one of these is a measurement made in this laboratory on the sample as received. The certificate names the method behind each figure, because the method is most of what the figure is worth.
- Purity
- The main peak’s area as a percentage of total area, against a stated specification. This is an area percentage at one wavelength, not a mass fraction — see the limits below.
- Identity
- Retention time compared against a certified reference standard run under the same conditions. A match is consistent with the declared compound; on its own it is not proof of structure, which is why certificates that carry it usually carry a mass confirmation too.
- Net quantity
- Response compared against a standard of known concentration, so the amount present can be stated against the amount declared.
The instrument
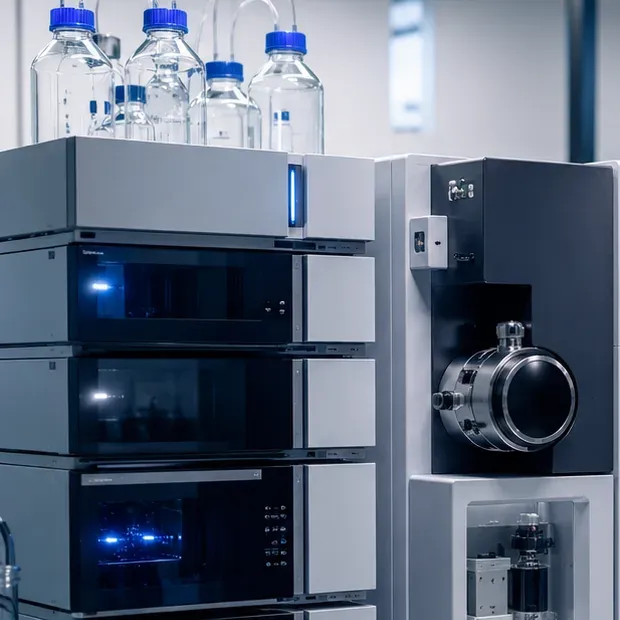
What a laboratory running this method has on the bench, and what each part decides about the result.
- Solvent delivery
- A binary or quaternary pump mixes the mobile phase and holds the gradient it was programmed with.
- Autosampler
- Injects a fixed, small volume — repeatably, which is what makes two runs comparable.
- Column oven
- Holds the column at a set temperature. Retention time drifts with temperature, so an uncontrolled column moves its own peaks.
- C18 column
- The separation itself. Particle size, pore size and packing decide what can be resolved from what.
- UV or diode-array detector
- Records absorbance. A diode array records a whole spectrum at each point rather than one wavelength, which helps show whether a peak is one component or two.
The detector decides what is visible
The column separates; the detector is what turns that separation into a number. It is also the half a method name mentions only in passing — the -UV in RP-HPLC-UV is not a suffix, it is the reason the purity figure is an area percentage at one wavelength. Every detector is blind to something, and what it cannot see does not appear on the chromatogram however much of it is there.
Ultraviolet / visible absorbance
- Sees
- Anything carrying a chromophore that absorbs at the chosen wavelength. It is the detector behind most purity figures, including the ones on these certificates, because it is stable, linear over a wide range and cheap to run.
- Blind to
- Everything without a chromophore. Salts, counter-ions, water and many residual solvents pass through and draw nothing, so a chromatogram can look clean while carrying a great deal of material the detector cannot see.
Fluorescence
- Sees
- Compounds that fluoresce naturally or have been derivatised to. Far more sensitive and far more selective than UV for those compounds, which is what makes it the usual choice for trace work.
- Blind to
- Everything that does not fluoresce — which is most things. Selectivity is the point and the cost: a fluorescence trace is not a picture of the sample, it is a picture of the part that fluoresces.
Refractive index
- Sees
- Any solute that differs in refractive index from the mobile phase, so it responds to compounds no optical detector reaches — sugars and many polymers among them.
- Blind to
- Nothing in particular, and that is its weakness: it responds to everything, including the mobile phase, so it cannot be used with a gradient and is markedly less sensitive than the alternatives.
Evaporative light scattering
- Sees
- Anything less volatile than the mobile phase. The eluent is nebulised and evaporated, and what is left scatters light — so it reports compounds that absorb nothing at all.
- Blind to
- Volatile analytes, which evaporate with the solvent. Its response is also not linear with concentration, so quantitation needs a calibration curve rather than an area ratio.
Mass spectrometry
- Sees
- Mass-to-charge ratio, which is a measurement about identity rather than quantity. It is the only detector on this list that can say what a peak is rather than that a peak is there.
- Blind to
- Compounds that do not ionise under the source conditions in use. Response also varies enormously between compounds, so a large MS peak beside a small one is not a statement about their relative amounts.
Electrochemical
- Sees
- Analytes that oxidise or reduce at the applied potential, with very high sensitivity and selectivity for them.
- Blind to
- Anything not redox-active at that potential. It is also sensitive to the mobile phase and to the state of the electrode, so it demands more method control than the optical detectors.
Separate first, then measure again
A chromatograph can be joined to a second instrument, so that what leaves the column is measured by a technique that answers a different question. The names are written with a hyphen for that reason: the second half is not an upgrade to the first, it is a different measurement made on the same separated material.
Worth knowing before commissioning analysis, because the difference between “HPLC reported 99.2%” and “HPLC-MS reported that the 99.2% is the compound declared” is the difference between a number and an identification — and only one of them can go on a certificate as identity.
Liquid chromatography with mass spectrometry
Identity. Chromatography says a peak eluted at a given time; the mass spectrometer says what mass came off at that time, so a retention-time match stops being circumstantial.
Reached for when: Confirming that the peak measured for purity is the compound declared, and identifying impurities rather than only counting them.
Liquid chromatography with tandem mass spectrometry
A second round of mass selection: a chosen ion is fragmented and the fragments measured, so the answer rests on a pattern rather than on a single number.
Reached for when: Identity confirmation and trace quantitation in matrices where one mass alone would be ambiguous. It has its own page on this site.
Liquid chromatography with nuclear magnetic resonance
Structure. NMR reports how the atoms in a molecule are connected, which is the one thing neither chromatography nor mass alone can establish.
Reached for when: Elucidating an unknown — a degradation product or a natural-product component — where the question is what the compound is and not how much of it there is.
Liquid chromatography with inductively coupled plasma mass spectrometry
Elements, and which chemical form they are in. ICP-MS alone reports how much arsenic is present; putting a column in front reports how much of it is in each species.
Reached for when: Trace element and heavy-metal work where the form governs the risk, since two species of one element are not interchangeable.
Liquid chromatography with capillary electrophoresis
A second separation on a different principle: electrophoresis sorts by charge and size, where chromatography sorts by affinity for the stationary phase.
Reached for when: Charged species — peptides, proteins and their variants — that a single chromatographic dimension resolves poorly or not at all.
Liquid chromatography with infrared spectroscopy
Functional groups. An infrared spectrum reports which bonds are present, which distinguishes compounds that share a mass and elute together.
Reached for when: Characterising complex organic mixtures where the distinction that matters is chemical rather than quantitative.
Liquid chromatography with gas chromatography
A cleanup and a second, sharper separation. The liquid column isolates a fraction and hands it to a gas column, which resolves volatiles far better than liquid chromatography does.
Reached for when: Volatile or semi-volatile components sitting in a matrix too dirty to inject into a gas chromatograph directly.
Liquid chromatography with thermal lens spectrometry
Sensitivity, for absorbing compounds. Absorbed light is measured as the heat it deposits rather than as light lost, which detects far smaller quantities than a UV cell at the same wavelength.
Reached for when: Trace work on strongly absorbing analytes — pigments among them — where a conventional absorbance detector runs out of signal.
Multidimensional chromatography
Peak capacity. The eluent from one column is fed to a second of different selectivity, so components that co-eluted in the first dimension separate in the second.
Reached for when: Samples whose peaks overlap — closely related impurities, isomers — where a single column reports one peak that is really two.
What it cannot establish
This list is the reason the rest of the page is worth reading. A figure, or an observation, means what its method can support and nothing past it.
- 01A purity figure by UV area is an area percentage at one wavelength. It is not a mass percentage, and converting between them requires response factors the method does not provide.
- 02Anything with no chromophore at the chosen wavelength is invisible. Counter-ions, salts, water and many residual solvents do not appear on the chromatogram at all, however much of them is present.
- 03A single peak is not proof of a single substance. Two compounds can co-elute, and a method has to be shown to separate them before the peak can be called one thing.
- 04A retention time match supports an identity, it does not establish one. Mass confirmation is the measurement that does.
- 05It says nothing about water content, residual solvent, endotoxin, sterility or biological activity. Those are separate determinations with separate methods.
Where it is used
- Purity and related-substance profiles for peptides and small molecules
- Assay against a reference standard
- Stability studies, by running the same method over time and comparing the profiles
- Release testing against a specification
- Oligonucleotides, where length variants have to be resolved from the full-length product
- Botanical and natural-product extracts, profiled rather than assayed for one component
- Polymers and additives, characterised by composition and by what else is present
Questions people arrive with
Asked about HPLC often enough to be worth answering here rather than by return of email.
Anything else, and the answer comes from a person rather than a page. Write to the laboratory.
What is an HPLC test on a drug substance?
A separation followed by a measurement. The material is dissolved and pushed through a column that holds each of its components back by a different amount, so they leave the column at different times; a detector records what comes off and when. It is used to measure how much of the declared compound is present, to see what else is present alongside it, and — run again later on retained material — to see whether either answer has moved.
How accurate is HPLC?
Accurate enough that the method is rarely the limiting factor, and repeatable enough that one laboratory running the same sample twice gets very nearly the same number. It resolves compounds that differ only slightly in structure and sees them well below the levels a specification usually cares about. What it does not hand you for free is agreement between laboratories: the figure depends on the calibration, the reference standard and the method, so two competent laboratories can both be right and still report different numbers.
What does HPLC stand for?
High-performance liquid chromatography. “Liquid” names the mobile phase, which is what carries the sample through the column and distinguishes it from gas chromatography. “High-performance” is the pressure: pumps drive solvent through a column packed with very fine particles, and it is the fineness of that packing rather than speed for its own sake that produces the resolution.
How is HPLC used in pharmaceuticals?
Wherever a number about composition is needed. Assay against a reference standard, content uniformity, related substances and degradation products, and stability studies that repeat one method over time and compare the profiles. It runs from early development through to release testing, which is why the same technique appears on a research report and on a certificate of analysis.
Why is HPLC used more than the alternatives?
Range and robustness, not superiority. It handles small molecules, peptides and complex mixtures on one instrument, it quantifies reliably, and its methods transfer between laboratories. It is not the most informative technique available — mass spectrometry establishes identity it cannot, and NMR establishes structure neither can. It is the default because it answers the commonest question, how much of what is here, more cheaply and more reproducibly than anything else.
Is this method run at ZEIKKA?
Yes. Reversed-phase HPLC with UV detection is run in this laboratory on material received here, against a certified reference standard. The certificate names the method, the date the analysis was run and the figures it produced, so a reader can weigh the result against what the method can support.
Does “98% pure by HPLC” mean 98% by weight?
No. It means the main peak accounted for 98% of the integrated area at the detection wavelength. Components that do not absorb there contribute nothing to that total, so the mass fraction can be lower — sometimes considerably, for a salt form.
Why are peptides read at 214 nm?
The amide bond of the peptide backbone absorbs there, and every peptide has one regardless of whether it contains aromatic residues. Reading at 280 nm instead relies on tryptophan, tyrosine or phenylalanine being present.
What makes the same sample give two different purity figures?
Most often the integration boundaries, the detection wavelength or the gradient. Column age and temperature move retention times and can merge or split a pair of peaks. Two figures from two methods are not a contradiction; they are two measurements.
Can HPLC tell me what an unknown compound is?
Not by itself. It can tell you how many components there are and in what proportion, and it can tell you that one of them behaves like a standard you already have. Identifying something you have no standard for needs a spectroscopic method.
Also cited on certificates
LC-MS/MS
A chromatographic separation feeding a mass spectrometer, so a component can be weighed rather than only timed.
GC
The separation for things that will travel as a vapour — residual solvents above all, which is the line a purity figure by HPLC cannot fill in.
SFC
The separation that can tell two mirror images apart — and the only one here that can, because on every other column they are the same compound.
SEM
The method that produces a picture rather than a number — and the one whose result depends most on how the sample was chosen.
Holding a certificate that cites RP-HPLC-UV?
Check its number against our record. No account, and the same check is open to anyone holding the document.